How to use chart components in Taro framework?
Problem Description
I want to use charting components in Taro framework, any recommendations for out-of-the-box charting libraries?
solution
Different chart libraries have different solutions. The following introduces the use of VChart chart library. In order to facilitate users to quickly access, VChart encapsulates the corresponding chart components: @visactor/taro-vchart. Currently, the environments supported by this component are:
ttbyte applet.larkFeishu applet.h5browser environment, equivalent toweb.webbrowser environment, equivalent toh5.
It is also very simple to use, just declare the component directly and pass in the corresponding chart configuration:
<VChart
   type="tt"
   spec={spec}
   canvasId="pie"
   style={{ height: '35vh', width: '100%' }}
   onChartInit={chart => {
     console.log('init pie');
   }}
   onChartReady={chart => {
     console.log('ready pie');
   }}
   onChartUpdate={chart => {
     console.log('update pie');
   }}
/>
Code Example
You can view our code repository directly: Link
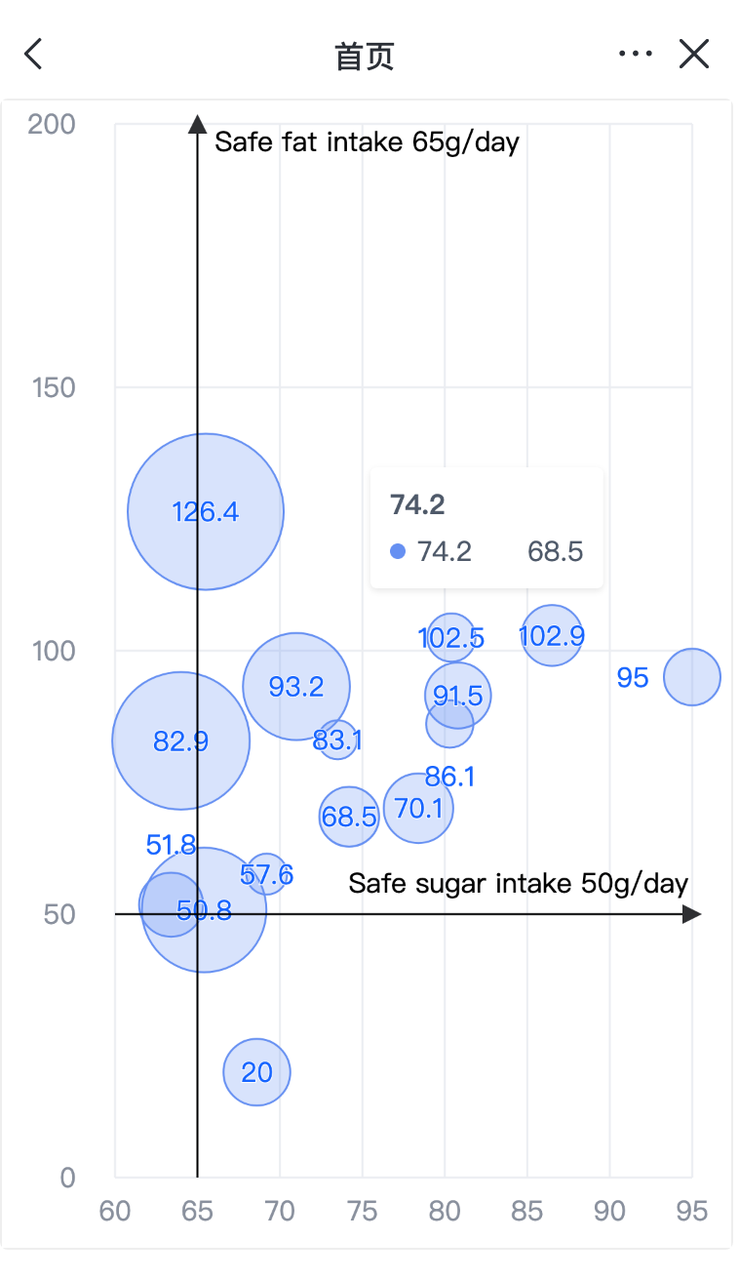
Result display
Let’s take the Feishu Mini Program as an example to see how VChart performs on the Feishu Mini Program:
Clone our warehouse: https://github.com/VisActor/VChart, run:
#clone
$ git clone git@github.com:VisActor/VChart.git
$ cdVChart
# Install dependencies
$ rush update
# compile
$ rush run -p @visactor/taro-vchart -s dev:lark
Then use Feishu developer tools to open and import packages/taro-vchart/dist.

